

The Device & Platform
Union Water treats and supplies water to 65,000 people in Kingsville, Leamington, and parts of Lakeshore and Essex. The water network consists of a treatment plant, booster pumping station, reservoir and four elevated tanks. Within the network Union Water has installed 26 flow meters, as well as 20 hydrant.AI pressure monitoring units. Each of the four municipalities operate as individual zones with interconnections in place in case of an emergency. The system is operated by the Ontario Clean Water Agency, and the hydrant.AI system was deployed to provide greater insight into the distribution system pressures.
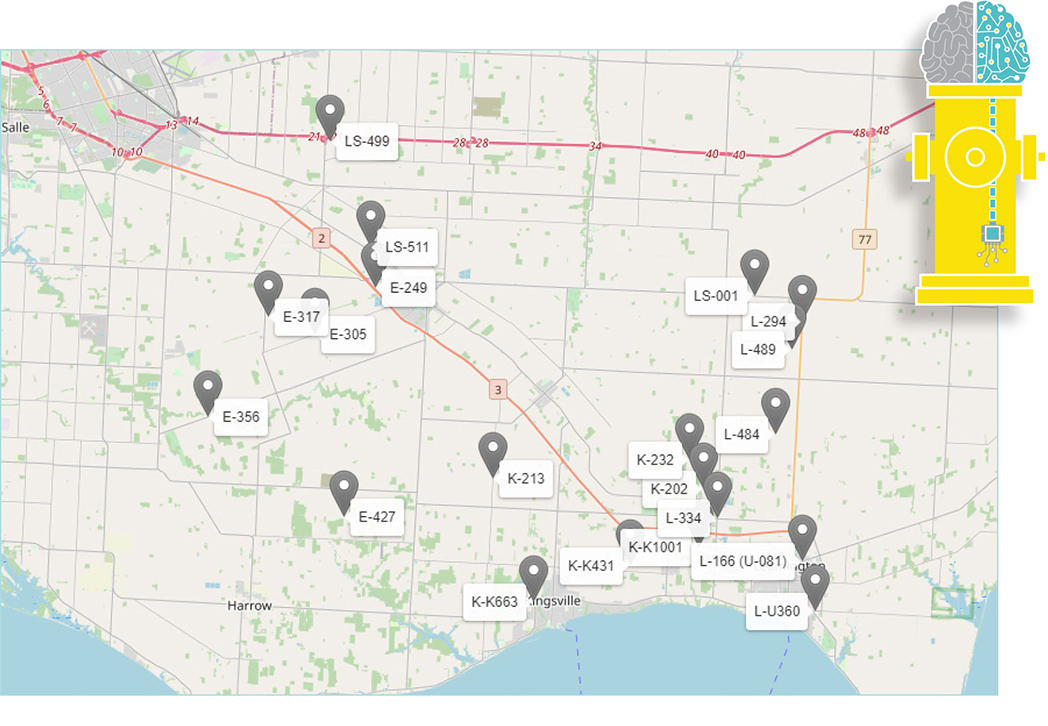
To date Union Water has installed two phases of the technology. In the initial phase implemented in 2020 units were installed in areas where there were complaints related to water pressure. Monitoring the extremes of the system provided Union Water and OCWA with a greater understanding of how the system operates and how the pressure varies across the local municipalities within the network.
The second phase was implemented in 2021 with the installation location of the units selected to provide both an overview of the areas, including high and low points, as well as areas of interest such as close to large users.
The Events
Union Water and OCWA have been able to gain greater insight into their system in the following key areas:
- Identification of transient events and their magnitude. A specific large 30 second, 40psi magnitude event was recorded and an investigation is underway.
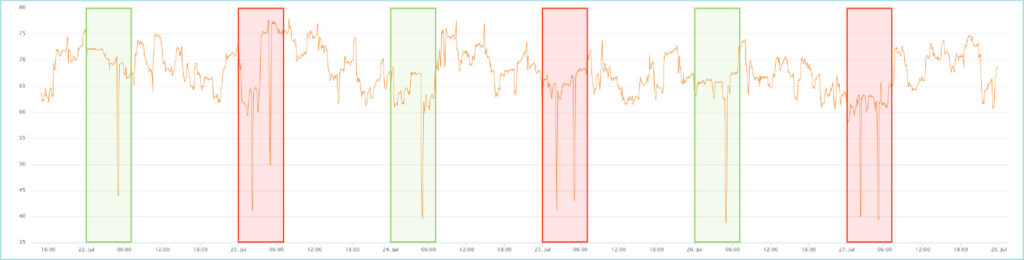
- Ability to observe the impacts of the flushing programs put in place by the local municipalities. The impact on pressures within the system has lead to improved operational co-operation between the water supplier and those responsible for the operation of the distribution network to try to reduce impacts on infrastructure which could lead to leaks/ breaks.
- Identification of flushing programs and the impact on the system of their auto-flushers, including identifying that the program for the auto-flusher was set to run every day, rather than the intended every other day AND the fact every second day resulted in a double flush event. After identifying this, the program was updated to save on non-revenue water (NRW).
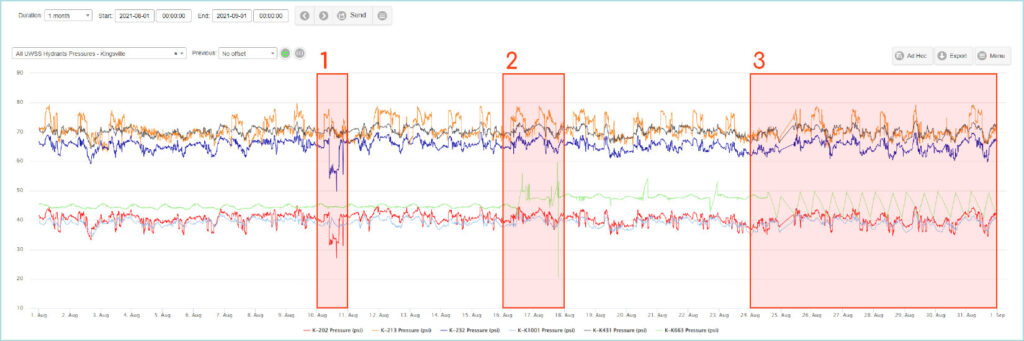
- Greater understanding into the pressure variations within the system, and confirmation of the pressures observed in low-pressure areas within the network. As examples we see (1) flushing events captured due to contractors accessing water, (2) a main break and (3) the monitoring of a water tower as it is brought online after servicing (fill/empty cycle.
“With this technology we were able to gain visibility into our water distribution network and see how various pressure and transient pressure events impacted our system. We were then able to enact changes to protect infrastructure, reduce breaks and mitigate immediate concerns within the water network.”
• Rodney Bouchard, General Manager, Union Water Supply System


